Please support our coverage of democratic movements and become a supporting member of rabble.ca.
So, the National Household Survey’s Portrait of Canada’s labour force is out, and I can’t help but think of Donald Rumsfeld’s known unknowns. We know that we don’t know anything about those who didn’t respond to the survey, or how they might be different from those that did. We also know that there are some discrepancies in terms of labour force data even at the national level when comparing the NHS to the LFS.
We know that the sample size for the NHS was 4.5 million households, with a 68.6 per cent response rate. The LFS only samples 56,000 households, but it is mandatory and conducted by specialized interviewers. And, finally, the LFS excludes persons living on reserve & in Aboriginal communities, and full-time members of the Canadian Forces, but the NHS does not. So which one gives us better labour market information?
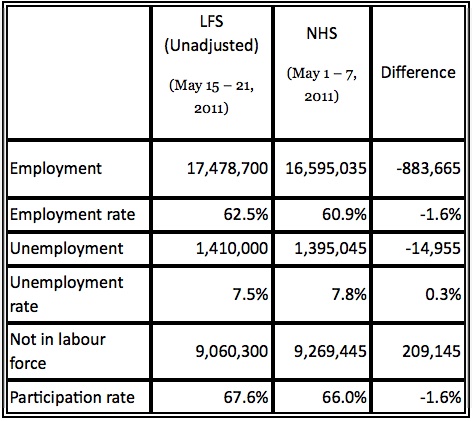
So the NHS estimates nearly 900,000 fewer jobs in May 2011 than the seasonally unadjusted data from the LFS, which results in a significantly lower employment rate. Has the labour market been doing worse than we think? Has the recovery been even more sluggish than the LFS numbers have led us to believe?
Which survey is more reliable right now isn’t even the biggest concern. If we are concerned about the NHS not reaching groups based on their education level, language, immigrant status, or more, then the accuracy of weighting for the LFS is bound to become less reliable as well. In 2011 the LFS was re weighted and revised based on the 2006 census, in 2016 the LFS will be reweighted and revised based on the 2011 NHS. Sam Boshra at Economic Justice covers this issue well here.
It’s okay to know what we don’t know — but I’m worried about thinking that we know something that “just ain’t so”.

Support rabble today!
We’re so glad you stopped by! Thanks for consuming rabble content this year.
rabble.ca is 100% reader and donor funded, so as an avid reader of our content, we hope you will consider gifting rabble with a donation during our summer fundraiser today.
Whether it be a one-time donation or a small monthly contribution, your support is critical to keep rabble writers producing the work you’ve come to rely on as a part of a healthy media diet.

Whether it be a one-time donation or a small monthly contribution, your support is critical to keep rabble writers producing the work you’ve come to rely on as a part of a healthy media diet.
Become a rabble rouser — donate to rabble.ca today.
Nick Seebruch, editor
