LOL
http://www.huffingtonpost.ca/2015/08/14/liberal-election-posters-star-tr...
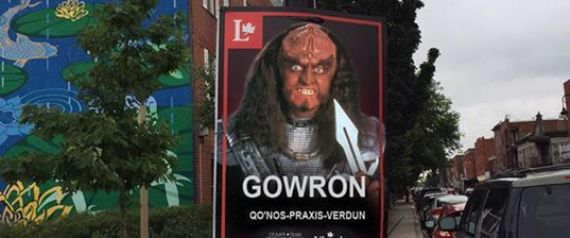
Gowron, Klingon High Council chancellor, is now running under the Liberal party banner. At least, that’s the suggested takeaway from one modified poster spotted in Montreal earlier this week.
A photo of the poster was uploaded to Facebook Wednesday showing a playful Star Trek-themed parody off the Liberal party’s red and black campaign poster colour scheme.
The designer obviously had fun drawing inspiration from the “sinister” tones of the party’s new campaign posters, even adding the detail the Klingon character is seeking a seat in the riding of Qo’nos-Praxis-Verdun.
For those just tuning into Canadian politics, there is no Qo’nos-Praxis-Verdun riding. It’s a blend of the name of a Klingon planet, its moon, hyphenated with the name of a Federation Starfleet starship.
" Jaime BabbGowron has always seemed like an LPC-man to me. Career politician; not much on principle. Became KlingonChancellor on a progressive platform of maintaining the alliance with the Federation, but then threw this promise out as soon as the winds of public opinion started blowing against him. He's just the leader Canada needs, really.I am looking forward to seeing disputes in the house of commons being settled by knife-fight though."
Love the above qoute in the comments section.
Chancellor Martok/Worf would be NDP.
Corrupt Chancellor K'mpec would be CPC. Actually Duras would have been a better example, but he was never Chancellor.

False imagery. Stats show that if all non-voters showed up for this election, the cons would walk away with another majority.
rofllmao @ slumberjack. must be a proponent of the Chicago school too.

rofllmao @ slumberjack. must be a proponent of the Chicago school too.
Why don't you stop stalking me around the board. This is getting creepy.
False imagery. Stats show that if all non-voters showed up for this election, the cons would walk away with another majority.
References?

Going to the link will render the graphic a little better.
SJ, I may not be understanding your point with those charts of 2011 election results, but it sure doesn't seem to support your hypothesis to me. First of all, the percent voting for the CPC are very unlikely to be as high in this election as they were in 2011. Second, these charts assume that the non-voters will break down into parties in the same proportions as the voters. There is a great deal of evidence that that is false. In fact, CPC supporters are significantly more likely to vote than other parties. That is why vote suppression works for the CPC. If you really do believe the improbable statement that if everyone voted, the Cons would get a majority, you'll have do a lot better than this to demonstrate it.
Going to the link will render the graphic a little better.
SJ -- yours is a completely incompetent reading of the graphic.
What you see is the number who did not vote in the graphic and the graphic of votes cast without them. Nowhere is there a case made about how those people who did not vote would have voted if they had decided to vote.
The graphic represents the voters and nonvoters form the 2011 election -- not the next election as you implied. The only majority anywhere on the graphic is the actual seat majority the Conservatives got in the FPTP system with ONLY voters being counted. Absolutely BS to suggest that this indicates non-voters would have increased the chance of a CPC majority had they voted.
And the majority you see -- and are misinterpreting -- is the actual majority OF SEATS the Conservatives got -- without the non-voters voting. No majority of votes is suggested anywhere.
You are completely wrong.
The few studies that have been done about non-voters indicate that the non voters came from the demographics least likely to support the Conservatives. While it is problematic to say with certainty that they would have voted exactly as those who did vote -- it is absolutely, mind-blowingly ridiculous to assume, as you are, that you have evidence that they would vote in some other way.
So my question to you is this -- did you completely misread this graphic or were you trying to BS us? There is a credibility issue with either answer.
The charts represent voting intentions from 2011 if mandatory voting had come to pass. In that event, the issue of which party supporters are more likely to vote is a moot one, because that question has been taken care of by the law, ie: everyone must vote, or else. Actually the charts extrapolate that conservative voters in 2011 are the least likely to be mobilized to the polls, because in that snapshot it looks as if mandatory voting will wind up helping the conservatives more than any other party. So in effect, con supporters stayed home in 2011 in greater numbers.
Nope -- they don't. Unbelievable you can't see this.
The graphics merely show the shares of actual votes cast vs shares of all potential voters showing the block of non-voters. You can check these numbers.
Nowhere do they attempt to show what would happen if non-voters actually voted. And of course it is rather silly to do anything other than speculate as to what non-voters would ahve done had they been forced into a decision.
You have completely misread this graphic. It provides no support to your thesis.
Gee boys with at least a hundred Election threads you chose a thread entitled LOL to talk technical points of hypothetical voters.
I take it neither of you have a sense of humour.
Now here is a real joke. Is that Christy Trudeau in that picture with Justin Clark? Boy are they ever photogenic. Just like peas in a pod.

SJ, I may not be understanding your point with those charts of 2011 election results, but it sure doesn't seem to support your hypothesis to me. First of all, the percent voting for the CPC are very unlikely to be as high in this election as they were in 2011. Second, these charts assume that the non-voters will break down into parties in the same proportions as the voters. There is a great deal of evidence that that is false. In fact, CPC supporters are significantly more likely to vote than other parties. That is why vote suppression works for the CPC. If you really do believe the improbable statement that if everyone voted, the Cons would get a majority, you'll have do a lot better than this to demonstrate it.
I cross posted with you -- in fact the graphic makes no assumptions at all. It merely includes non-voters into the numbers so you can compare their numbers with voters. It does not suggest at all how the non-voters would have been expected to vote. SJ is out to lunch in suggesting any case is made in that direction.
It is a little like a poll that leaves the undecided in so you can see the size of the people who have not decided -- it makes no presumptions about what those undecided people would do.
Graphic 1-- Quebec with non voting in -- so you can see the percentage each party got of eligable voters (a good argument against PR and false majorities).
Graphic 2-- Canada with non-voting -- again so you can see the percent of eligible voters for each party alongside non-voters.
Graphic 3-- Canada vote breakdown -- exactly what the votes were -- without the non-voters included
Graphic 4-- the actual seat breakdown in percentage terms
All of these graphics relate to the 2011 election and what happened -- just with the blocks of non-voters in visible as a part of the total breakdown. There is no indication of what the non voters would ahve done if they had been forced to vote.
Absurd interpretation you have there.
I did not choose this thread for the discussion -- just replying to the comment with graphic becuase it is here...
And I have a sense of humour.
And your picture is hilarious...
SJ, I may not be understanding your point with those charts of 2011 election results, but it sure doesn't seem to support your hypothesis to me.
The refrain we keep hearing from some people, without evidence, is that by not voting, this helps elect conservatives. I put forward some evidence to the contrary.
First of all, the percent voting for the CPC are very unlikely to be as high in this election as they were in 2011.
That's true, things have shifted somewhat. On the other hand, we have looked at fairly recent polling data introduced here on the board that suggests the NDP would not necessarily be the first choice for your average conservative leaning voter, or conservative non-voter for that matter. In the event of mandatory voting, people who might be a conservative minded person, but who ordinarily does not vote, might very well bleed toward the Liberals as their second choice if they were fed up with say, conservative party corruption. All to say, it is not necessarily the case even now that the NDP would stand to benefit from mandatory voting over its rivals to any great extent as some would like to think.
Second, these charts assume that the non-voters will break down into parties in the same proportions as the voters. There is a great deal of evidence that that is false. In fact, CPC supporters are significantly more likely to vote than other parties. That is why vote suppression works for the CPC. If you really do believe the improbable statement that if everyone voted, the Cons would get a majority, you'll have do a lot better than this to demonstrate it.
The charts represent voting intentions from 2011 if mandatory voting had come to pass. In that event, the issue of which party supporters are more likely to vote is a moot one, because that question has been taken care of by the law, ie: everyone must vote, or else. Actually the charts extrapolate that conservative voters in 2011 are the least likely to be mobilized to the polls, because in that snapshot it looks as if mandatory voting will wind up helping the conservatives more than any other party. So in effect, con supporters stayed home in 2011 in greater numbers. If mandatory voting compelled all of the non voters out to vote, from 2011 stats there has to be a greater swing in 2015 from the conservative non-voting numbers toward other parties, in whichever manner that gets distributed.
Graphic 3-- Canada vote breakdown -- exactly what the votes were -- without the non-voters included
SJ -- yours is a completely incompetent reading of the graphic.
When it says in graph 3 "Without absention," I just assume all non-voters turned out to vote for the purpose of that exercise. Because if it was with absention, then to my mind the graph would have to show that as a percentage, or else, it might be mistaken for the reason why everyone's slice of the pie expanded like it did. Hmmm.
Graphic 3-- Canada vote breakdown -- exactly what the votes were -- without the non-voters includedSJ -- yours is a completely incompetent reading of the graphic.When it says in graph 3 "Without absention," I just assume all non-voters turned out to vote for the purpose of that exercise. Because if it was with absention, then to my mind the graph would have to show that as a percentage, or else, it might be mistaken for the reason why everyone's slice of the pie expanded like it did. Hmmm.
Huh?
These are the actual results shown as a percentage of voters. The previous was a breakdown of the results as a percentage of eligible voters -- thereby showing the non-voters.
Not sure how you could get this wrong-- as it is clear this is the 2011 election and the numbers (without abstentions) are the official seats and popular vote numbers from that election.
rofllmao @ slumberjack. must be a proponent of the Chicago school too.Why don't you stop stalking me around the board. This is getting creepy.
what is getting creepy is you saying this untrue statement about me.

From the Toronto Star

Huh?
The graph is from an article on Abstention. The 'without abstention' results are hypothetical based on polling trends at the time.
Huh?The graph is from an article on Abstention. The 'without abstention' results are hypothetical based on polling trends at the time.
No SJ you are 100% absolutely wrong.
They are the actual results -- why are you arguing this when you can check?
The graphic is perfectly clear and well labled.
It simply means without non voters included (official results) as opposed to with non-voters.
This is silly the information is official and available to you --
There is nothing hypothetical here at all -- just with and without the non-voters in a similar way as pollsters may show raw data with and without undecided removed.
SJ -- Look at the graphic bottom right. It has the seats in the House -- 53.9% Conservative. the Conservatives won 166 seats -- that is 53.9% of the seats.
Look on the left : the data is within a percentage of the final official votes cast. The difference is due to this graphic being produced using the preliminary results but you can see clearly that this is the popular vote figures from the 2011 election (with the minor variation based on non-official results).
Look at the top two graphics. They show the identical proportion of votes between the parties from the election in Quebec and federal -- except they include the nonvoters (reducing the official tally accordingly. This shows the percentage each party got of eligible voters rather than of actual voters.
This is absolutely clear.
There is no data here trying to project what the non-voters would have done. I have seen such speculation and it did not show a Harper victory - that speculation re-tabulated results based on the weight of age groups to attempt to show what would have happened if all age groups voted at the same rate (Over 70% of eligible voters cast ballots in the 65-74 age group and less than 39% did in the 18-24 age group -- for example.)
There is no other way of estimating what non voters would have voted had they voted. I think these assumptions are suspect -- but the one you are making is completely ridiculous based on a completely incomptetent reading of this graphic.
Stoip arguing and go look closely at it and read it again. Compare the figures -- they are all the actual results with and without non-voters. The graphic was done on election night reflecting the preliminary results -- not based on a later study or any methodology where there is an attempt to presume how non-voters would ahve voted. You simply have no case AT ALL on this.
Here is wiki -- it was updated after the election with the official results -- but the differences are very, very minor.
https://en.wikipedia.org/wiki/Canadian_federal_election,_2011
***
If you insist on continuing this -- perhaps you should start with explaining exactly how anyone could even create the kind of graphic you are claiming this is (rather than what it actually is which is actual results). How do you propose to imagine knowing how non-voters would have voted -- in some way different from voters. The flawed presumption that they would have voted the same as voters of the same age is at least scientific --even if faulty. Imagining something different needs data that -- by definition -- cannot exist.
Well, maybe this thread is aptly named after all, and if I'm being a Jethro about that graph then I'll admit it. There is more than one way of reading it if the graph alone is being referred to in the context of abstention. I still contend that mandatory voting will not improve any party's fortunes per se, except that it will provide for enforced fealty to a shitty despotism that only offers the potential for a change in rulers every so often. But therein lies the difference between a partisan and someone who isn't. We are open to having our ideals challenged, and to adjusting our thought processes based on the evidence presented.
Well, maybe this thread is aptly named after all, and if I'm being a Jethro about that graph then I'll admit it. There is more than one way of reading it if the graph alone is being referred to in the context of abstention. I still contend that mandatory voting will not improve any party's fortunes per se, except that it will provide for enforced fealty to a shitty despotism that only offers the potential for a change in rulers every so often. But therein lies the difference between a partisan and someone who isn't. We are open to having our ideals challenged, and to adjusting our thought processes based on the evidence presented.
I am not advocating mandatory voting here. My positon is not about being partisan. As I said before you have this backwards.
I don't buy the "enforced fealty" stuff either.


Anyone who saw the movie would be taken aback at this. The character was very decent.


oh my what a cute Bible steal. this will hit the Harper faithful hard...


This image was part of the announcement made in Campbell River, "the Salmon Capital of the World." The joke for those that don't know their fish is that this is not a Pacific salmon but rather an Atlantic salmon.
The wheels on the Harper bus are starting top fall off. This was the same regional tour that included an unethical photo-op with Scouts in uniform.

Best election thread on Babble ....

Love it -
Is the Liberal one done yet?
This image was part of the announcement made in Campbell River, "the Salmon Capital of the World." The joke for those that don't know their fish is that this is not a Pacific salmon but rather an Atlantic salmon.
The wheels on the Harper bus are starting top fall off. This was the same regional tour that included an unethical photo-op with Scouts in uniform.
They also pooched another one on adoption, the family is Sloviaks, not Canadians, and the child.is not adapted.
So many Canadians would really wish that they could be standing behind Harper with him in this position -- while wearing steel-toed boots.

So many Canadians would really wish that they could be standing behind Harper with him in this position -- while wearing steel-toed boots.
No truer words have ever been spoken.
Hilarious.
This image was part of the announcement made in Campbell River, "the Salmon Capital of the World." The joke for those that don't know their fish is that this is not a Pacific salmon but rather an Atlantic salmon.

http://montrealsimon.blogspot.ca/2015/08/fish-man-harper-and-latest-con-...
Hilarious.
and if Harper and Duffy were reversed it would be just as funny when you think about it.
This image was part of the announcement made in Campbell River, "the Salmon Capital of the World." The joke for those that don't know their fish is that this is not a Pacific salmon but rather an Atlantic salmon.
http://montrealsimon.blogspot.ca/2015/08/fish-man-harper-and-latest-con-...
I hear Conservative voters in BC are going on the endangered species list now.
I hear Conservative voters in BC are going on the endangered species list now.

http://montrealsimon.blogspot.ca/2015/08/fish-man-harper-and-latest-con-...