Ever since the U.S. Congress adopted the gross national product (GNP) in 1937, capitalism has promoted pursuit of an ever-increasing GNP — now the GDP (gross domestic product) which is seen as the indicator of the constantly improving quality of modern life.
When the GDP shrinks, as it did in March and April 2020 because of COVID-19, then businesses are hurt, jobs are squeezed and usually money is tight for most people. “The numbers … leave no question that Canada is in the midst of its deepest recession in decades,” said the Conference Board of Canada’s associate director, Alicia Macdonald, on May 29.
On the other hand, the conference board’s first quarter report noted that, “Household disposable income increased despite the sharp decline in employment thanks to government transfers [e.g. CERB] With income increasing and spending falling, the savings rate shot up to 6.1 per cent and is expected to continue to climb in the second quarter.”
Such contradictory results add to the recent questions about using the GDP as the world’s primary economic metric. Nobel-winning economist Joseph Stiglitz and MIT Professor Erik Brynjolfsson told the 2016 Davos Conference that the “GDP is a poor way of assessing the health of our economies and we urgently need to find a new measure.”
As more economists challenge the GDP’s basic premise — that growth equals social benefit or even good economic health — the GDP looks more and more like only one side of what should be a balance sheet, where the other side would show the nation’s or the globe’s losses, liabilities and scores for environmental and human rights responsibilities.
Perversely, “the GDP counts ‘bads’ as well as ‘goods,'” noted CBS’ Moneywatch. “When an earthquake hits and requires rebuilding, GDP increases. When someone gets sick and money is spent on their care, it’s counted as part of GDP. But nobody would argue that we’re better off because of a destructive earthquake or people getting sick.”
More than ever, U.S. corporate prosperity comes at a cost to workers, to which the GDP is blind. In 2017, Thomas Piketty, Emmanuel Saez and Gabriel Zucman published a major study on the distribution of income within the U.S. They found that, since 1980, “The average pre-tax income of the bottom 50 percent of adults has stagnated at about $16,000 per adult,” while the top one per cent of adults increased their average incomes from $420,000 to about $1.3 million.
“In 1980, top 1% of adults earned on average 27 times more than bottom 50% of adults before tax,” the group reported, “while today they earn 81 times more.” The increasing distance between top and bottom wage earners is another metric the GDP omits.

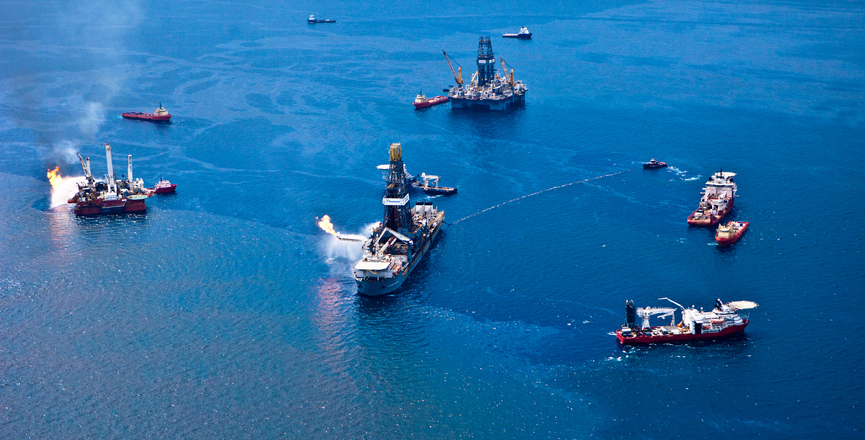
Cleaning up after catastrophes may also boost the GDP, no matter how much damage the catastrophe inflicts. Take the 2010 BP oil spill in the Gulf of Mexico, when the Deepwater Horizon exploded, killing 11 out of 126 workers. Over the next three months, a broken pipe to a deep water well spilled an estimated 184 million gallons of crude oil (18 times as much as the Exxon Valdez spill) into the ocean and onto the shores.
“As of July 14, 2016, BP had spent $61.6 billion in court fees, penalties, and clean-up costs,” according to financial expert Kimberly Amadeo. BP took another $1.7 billion charge in 2018. Fishing and tourism industries in four states suffered incalculable long term damage. But in GDP terms, the catastrophe was good for the local economy.
“JPMorgan Chase calculated that oil spill clean-up efforts actually boosted the economy in 2012,” notes Amadeo. “BP spent $6 billion to hire 4,000 people to clean up the spill that year. This contributed more than the $700 million lost in fishing and tourism revenues and the 3,000 jobs lost to the six-month deep-water drilling moratorium. But that didn’t count long-term costs or things that aren’t counted in gross domestic product such as the value of human and animal life that was lost.”
No wonder then that social scientists and economists have been proposing other economic metrics for decades. For example, the four pillars of Bhutan’s gross national happiness index (proclaimed in 1972) are: good governance, sustainable socio-economic development, preservation and promotion of culture, and environmental conservation.
Canada’s GPI Atlantic (genuine progress indicator), founded 1997, has worked with Bhutan to achieve its happiness goals. In fact, both U.S. and Canadian governments have maintained their own annual GPI evaluations since 1995, although without much attention.
The GPI captures intangible infringements on public well-being. As economist and business strategist David Korten puts it, many business costs are “externalized,” in the form of uncontrolled air and water pollution. In 2000, Korten mentioned at a public event that a public accountant had put together an inventory estimating all the costs that corporations externalize onto the public sphere in the United States, and came up with the figure of US$2.6 trillion a year.
In a 2019 report, a group of New Zealand academics applied GPI metrics retroactively to NZ’s economy from 1970-2016. They reported: “… the genuine progress indicator shows our societal progress is not as rosy as GDP indicates … Overall, on a per capita basis, since 1970 the GDP increased by 91 per cent, whereas the genuine progress indicator, which gives a more accurate measure of the nation’s well-being only increased by 53 per cent …”
To extend the GPI’s initial questions, the Canadian Index of Wellbeing (CIW) launched in 2009. The CIW sets out a survey framework of eight domains with eight questions each, such as proportion of residents who experience discrimination. Housed in the University of Waterloo, the CIW studies show that individual Canadians are getting hammered by the gig economy, even though the economy has rebounded since the 2008 market crash.
Now that COVID threatens the service industries that make up more than half of Canada’s economy, now is a good time to look at how and what our economic instruments actually measure. A growing GDP is meaningless if people are going hungry — and they are. Back in Depression days, in 1937, economists created the GDP in order to track much-desired economic growth. Losses were already too numerous to count.
These days, facing the climate crisis, we need to count and conserve every tree, every barrel of oil, every mouthful of food.
We need to flatten the curve on CEO salaries, and share resources instead of squandering them on military weapons for U.S. police forces. We need to stanch our losses — be they starving children, endangered species, melting glaciers or burning forests — and put our efforts to reviving the global ecology that sustains us all. And to do that, we need economic metrics that include environmental and social dimensions. We need to replace the GDP.
Award-winning author and journalist Penney Kome has published six non-fiction books and hundreds of periodical articles, as well as writing a national column for 12 years and a local column in Calgary for four years. She was editor of Straightgoods.com from 2004-2013.
Image: kris krüg/Flickr
Support rabble today!
We’re so glad you stopped by! Thanks for consuming rabble content this year.
rabble.ca is 100% reader and donor funded, so as an avid reader of our content, we hope you will consider gifting rabble with a donation during our summer fundraiser today.
Whether it be a one-time donation or a small monthly contribution, your support is critical to keep rabble writers producing the work you’ve come to rely on as a part of a healthy media diet.
Whether it be a one-time donation or a small monthly contribution, your support is critical to keep rabble writers producing the work you’ve come to rely on as a part of a healthy media diet.
Become a rabble rouser — donate to rabble.ca today.
Nick Seebruch, editor