With all the recent news stories — as well as alarm raised by other leaders — about the fiscal and economic impact and record of NDP governments, I decided to take a look at the fiscal record of all federal and provincial governments in Canada for the past three decades.
These results may be surprising to some: they show that NDP governments have the best fiscal record of all political parties that have formed federal or provincial government in Canada.
Of the 52 years the NDP has formed governments in Canada since 1980, they’ve run balanced budgets for exactly half of those years and deficits the other half. This is a better record than both the Conservatives (balanced budgets 37% of years in government) and the Liberals (only 27%), as well as both Social Credit and PQ governments. See first chart below.
It’s not just the number of years of balance that is relevant: it’s also the size of the deficits or surpluses that are important. For this, the most important figure is the size of deficits as a share of GDP.
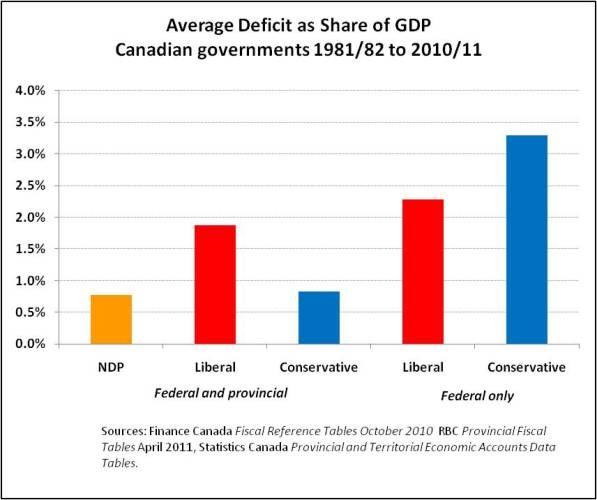
For this measure as well, NDP governments have the best record. The average balance (deficit) as a share of provincial GDP for the 52 years of NDP governments in Canada is -0.77%, compared to -1.82% for all Liberal governments and -0.82% for all Conservative governments over the past thirty years. See second chart below.
The first set of figures is for all federal and provincial governments in Canada. It’s a reasonably large sample for the major parties: 157 years of Conservative governments, 106 years of Liberal governments and 52 years of NDP governments represented at one time in all different western, central and eastern regions of Canada.
The second chart with deficit shares of GDP also shows the record for federal governments in Canada over the past thirty years. And for this, it’s a different story: Conservative governments have a worse fical record than Liberal governments: they’ve been in deficit 11 out of the 14 years (or 79%) they’ve run the federal government and run deficits averaging 3.3% of the economy, compared to an average of 2.3% for the Liberals, with 8 out of 17 years running balanced budgets.

None of this is to argue that governments shouldn’t run deficits when it is necessary and beneficial for the economy; however, it is interesting to see that there’s no little for the fear-mongering about NDP governments having a poor fiscal record.
There’s consistent public accounts data on deficits for provincial and federal governments since 1980/81 through Finance Canada’s Fiscal Reference Tables. I’ve supplemented these with more recent figures published by RBC in their Provincial Fiscal Tables report. (The data from Statscan on provincial GDP are only available from 1981, which is why this period starts one year later).
Statscan also publishes data on government finances on a “national accounts” basis: the fiscal concepts are different, but the results are similar as these. I’ve left Social Credit and PQ governments out of this second chart because they are regional parties with relatively few years in government: on average their fiscal balance has been a deficit of over 1% of GDP.
This article was first posted on The Progressive Economics Forum.
Support rabble today!
We’re so glad you stopped by! Thanks for consuming rabble content this year.
rabble.ca is 100% reader and donor funded, so as an avid reader of our content, we hope you will consider gifting rabble with a donation during our summer fundraiser today.
Whether it be a one-time donation or a small monthly contribution, your support is critical to keep rabble writers producing the work you’ve come to rely on as a part of a healthy media diet.
Become a rabble rouser — donate to rabble.ca today.
Nick Seebruch, editor