
75,000
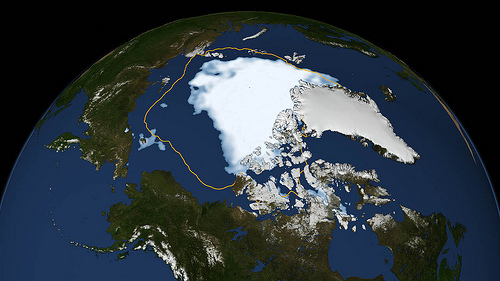
Square kilometres of Arctic sea ice that melted every day in August 2012. That’s like losing ice the size of New Brunswick every 24 hours. (Source)
10
Number of years in which Arctic sea ice could vanish. “Very soon we may experience the iconic moment when, one day in summer, we look at satellite images and see no sea ice coverage in the Arctic, just open water.” (Source)
2050
The year leading water scientists say humans may be forced to shift to a vegetarian diet due to population growth and limited water supplies. (Source)
2
Percentage of Canadians who doubt climate change is happening. (Source)
16
Percentage of Americans who deny climate change is happening. (Source)
32
Percentage of Canadians who believe climate change is happening because of human activity. Only nine per cent believe climate change is occurring due to natural climate variation. (Source and source)
#4
Canada has the fourth highest greenhouse gas emissions, per capita, in the world. (Source)
22
Tonnes of carbon dioxide equivalent emitted per capita in Canada in 2008. America emitted 22.8 tonnes per capita that year. (Source)
51
Percentage of Canadians who believe electricity production in Canada will still rely on fossil fuels by 2050. That belief is highest in Alberta (66 per cent) and lowest in Quebec (37 per cent). (Source)
#3
Due to the tar sands, Canada’s proven oil reserves are now the third largest in the world, behind Saudi Arabia and Venezuela. (Source)
10
Number of years Canada’s proven crude oil and natural gas reserves are expected to be entirely depleted. (Source)
14.3
Percentage by which Canada might fall short of its promise to cut greenhouse gas emissions by 2020. Canada committed to a 17 per cent reduction by 2020 but will likely only cut emissions by 2.7 per cent. (Source)
The Canadian Centre for Policy Alternative’s Trish Hennessy has long been a fan of Harper Magazine’s one-page list of eye-popping statistics, Harper’s Index. Instead of wishing for a Canadian version to magically appear, she’s created her own index — a monthly listing of numbers about Canada and its place in the world. Hennessy’s Index — A number is never just a number — comes out at the beginning of each month.
Image: Scientific Visualization Studio, NASA Goddard Space Flight Center/Flickr
What’s Harper up to? Award-winning journalist Karl Nerenberg keeps you in the know. Donate to support his efforts today.
Support rabble today!
We’re so glad you stopped by! Thanks for consuming rabble content this year.
rabble.ca is 100% reader and donor funded, so as an avid reader of our content, we hope you will consider gifting rabble with a donation during our summer fundraiser today.

Whether it be a one-time donation or a small monthly contribution, your support is critical to keep rabble writers producing the work you’ve come to rely on as a part of a healthy media diet.
Become a rabble rouser — donate to rabble.ca today.
Nick Seebruch, editor
