Like this article? rabble is reader-supported journalism. Chip in to keep stories like these coming.
One consequence of Canada becoming a low taxation country is that we are now doing less to reduce income inequality than at any time since the mid-1980s. This note analyses Canada’s taxation and transfers system from a historical and international perspective, focussing on how changes in Canada’s fiscal redistribution over the last two decades have increased after tax income inequality.
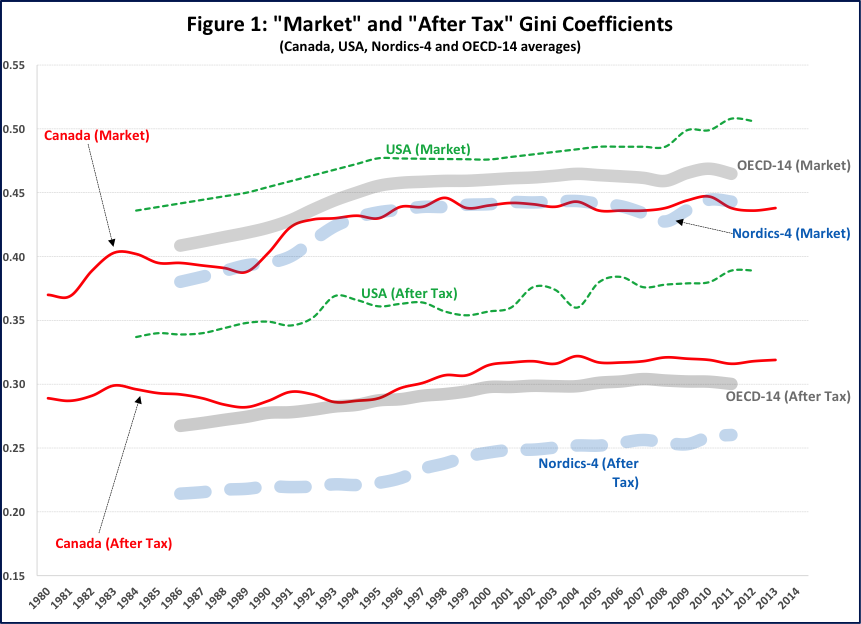
Figure 1 presents “market” and “after tax” income Gini coefficients for Canada and a sample of OECD countries. “Market” income is before taxes and government cash transfers (such as GIS, social assistance, EI, etc.), while “after tax” income is after taxes and transfers. The Gini coefficient is a measure of differences in income and is the most commonly used measure of inequality, varying from 0 to 1.00, with higher values representing higher inequality.
For comparative purposes, I include the “OECD-14” average (representing the 14 OECD Member-Countries for which Gini coefficients are available from the mid-1980s), as well as the traditional inequality/taxation revenue “book-ends”: the U.S. and the four larger Nordic countries (“Nordics-4”: Denmark, Finland, Norway and Sweden).

Figure 1 shows that market income inequality generally increased relatively quickly until the mid-1990s, after which it slowed down or stabilized across the OECD-14. Canada’s market inequality is below the OECD-14, similar to that of the Nordics-4 and lower than the U.S. Governments redistribute income via the tax and transfer systems (“redistribution”) so after tax income Gini coefficients are always lower than the respective market income Gini coefficients.
Redistribution varies significantly across time and countries. For example, Canada has historically had lower market inequality than the OECD-14, but has historically had higher after tax inequality.
One way to measure redistribution is presented in Figure 2, which shows the percentage difference between market and after tax income Gini coefficients. For example, Canada’s figure of 34 per cent for 1994 indicates that redistribution reduced market to after tax inequality from 0.432 to 0.287.
Figure 2 confirms that Canada (currently at 27 per cent) has traditionally had less redistribution than the OECD-14 (currently at 35 per cent) and the Nordics-4 (currently at 41 per cent) and that its redistribution has decreased since peaking in 1994. Redistribution in Canada has been closer to the U.S. (currently at 23 per cent) for more than a decade.

A country’s redistribution is a combination of its taxation revenues and allocation of expenditures (including to transfers). Figure 3 presents total (“all Government”) taxation revenues as a percentage of GDP and shows a steady increase and subsequent stabilization until about the mid/late 1990s for Canada, the OECD-14 and the Nordics-4, at around 35 per cent, 37 per cent and 45 per cent, respectively (the USA is an outlier at around 25 per cent).
Figure 3 shows that Canada’s taxation revenues to GDP started to decline in the late 1990’s so that by the 2010s Canada had stabilized at around 30 per cent-31 per cent; Canada’s taxation revenues to GDP ratio is now closer to the USA than the OECD-14 and is at its lowest level since 1980.

Research has shown that transfers have generally accounted for about two-thirds of the redistributive impact, with taxes accounting for the other third. Personal income tax (PIT) revenues to GDP in Canada have been historically similar to those in the OECD-14, and hence cannot explain the differences in redistribution.
In fact, Figure 4 shows that these differences are due to transfers; Canada has historically had lower transfers to GDP than the OECD-14. Taken together, Canada’s relatively low and decreasing taxation revenues to GDP and its low allocation to transfers have led to comparatively low and decreasing transfers, resulting in low and, and since 1994, decreasing redistribution.

Canada’s tax and transfers have historically provided less fiscal redistribution than almost all our OECD-14 counterparts. Most of the difference in this performance is due to Canada’s low and declining transfers, which together with lower personal income taxes, has led to higher after tax income inequality in Canada over the last two decades.
This is in spite of underlying market income inequality being relatively stable over this period. In almost all these respects Canada has diverged from the OECD-14 and converged to the U.S. over the last two decades.
Rising inequality is not inevitable — changes in fiscal redistribution are policy-induced and therefore open to change. Other OECD-14 counterparts have achieved and maintained much higher redistribution and lower after tax income inequality. We in Canada can and should do better.
A more comprehensive version of this note, including an assessment of the new Federal Government’s proposed taxation and transfers initiatives, is available here.
Edgardo Sepulveda has been a consulting economist for more than two decades advising Governments and operators in more than 40 countries on telecommunications policy and regulation matters (www.esepulveda.com).
Like this article? rabble is reader-supported journalism. Chip in to keep stories like these coming.


