This week, the Ontario Federation of Labour and CUPE Ontario published calculations I prepared of how Ontario Conservative leader Tim Hudak’s promise to eliminate 100,000 public sector jobs will be felt at the local level, on cities and communities across the province.
The original OFL release provides info on the magnitude of these impacts for the 15 largest census metropolitan areas across Ontario, for which labour force survey figures are available, a second release has the impacts for smaller communities, while CUPE Ontario has put a map on-line that shows the impact for all the metro areas and a number of smaller cities and towns (or “census agglomerations”). Below I include some details on how the numbers were calculated and provide the impacts for the full list of communities.
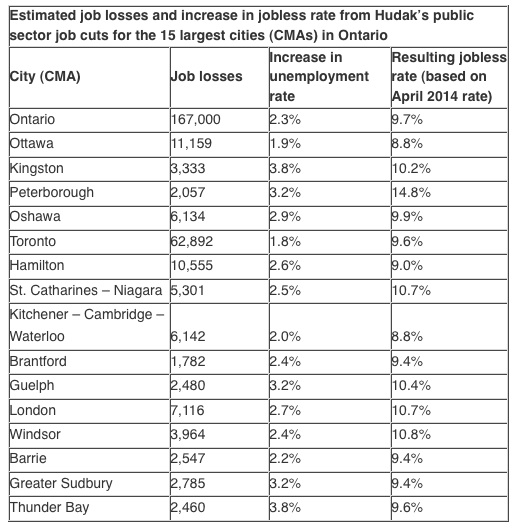
These job cuts — more extreme than under Mike Harris — would be devastating for many communities. As I outlined in a previous post, if the elimination of 100,000 public sector jobs plus the spin-off jobs led to an equivalent increase in unemployment, Ontario’s unemployment rate would reach 9.7 per cent (based on an increase from current rates) — the highest in 20 years.
But the impacts would be even greater for particular communities. What this analysis shows is if public sector jobs are eliminated proportionally, the impacts would be especially severe for mid- and smaller-sized cities and towns in the province–and could lead to double-digit unemployment rates in many.
For example, if the cuts were implemented proportionately, Kingston could see an increase in its unemployment rate by 3.8 percentage points up to 10.2 per cent; Peterborough up by 3.2 per cent to 14.8 per cent; Oshawa up by 2.9 per cent to 9.9 per cent; Guelph up by 3.2 per cent to 10.4 per cent and Greater Sudbury up 3.2 per cent to 9.4 per cent.
This is because, perhaps contrary to the perception of many, public sector employment actually tends to be proportionally higher in mid-sized and smaller cities than in larger cities. These public sector jobs are also an important source of economic stability in these communities because the jobs are more stable and are decently, or at least more equitably, compensated. The cruel irony is that the smaller cities and towns that are often a base of Conservative strength would be most damaged by the deep cuts Hudak is planning.
The impacts of public sector job cuts of this magnitude would be at odds with the way Hudak and his Conservatives are trying to sell them: as cutting “100,000 jobs in the bureaucracy” that would have little impact on front-line services or local communities.
The reality is the large majority of public sector workers are front-line workers. According to StatsCan data over 400,000 Ontarians work in education (locals schools, universities, colleges and trades schools); about 236,000 work in health care and social services (hospitals, community clinics, residential care); about 275,000 for local governments; and about 40,000 for provincial crown corporations such as Hydro, the LCBO etc.
In fact, there were only approximately 90,000 employed in the core provincial public service. This includes the classic government worker or “bureaucrat” that Hudak loves to disparage, but it also includes many others, including provincial police, judicial employees, and those working for agencies, boards and commissions.
So there’s no question: the cuts Hudak would implement would result in significant cuts to front-line public services and would have a major impact on communities across the province. Even prominent conservative columnist Tasha Kheiriddin (formerly director with the Fraser Institute and Canadian Taxpayers Federation) recently wrote she won’t vote for Hudak because she realizes he will cut public services her autistic daughter needs.
(While Hudak claims only private sector jobs create wealth, private sector industries and companies can often be more bureaucratic with higher administration costs than the public sector. For example administrative costs in the U.S. private health-care system are about three times the administration costs in Canada’s largely public system).
How these job impact figures were calculated
These figures are based on the most detailed employment by industry and occupation figures that are readily (and freely) available for communities in Canada: data from the National Household Survey (NHS).
From this I calculated employment in public sector industry groups at the four-digit (most detailed) level for the 48 “Census Divisions” (CDs) in Ontario (from NHS Table 99-012-X2011052) and separately for the 42 different Census Metropolitan Areas (CMAs) and smaller Census Agglomerations (CAs) (from NHS table 99-012-X2011034).
Sixteen different industry groups at the four-digit level were included, with most of the employment from these in education, health care and social services and public administration, but excluding employment in federal and aboriginal public administration. However, I included in this local, regional and municipal public administration because Hudak was reported as saying he would also force municipalities to cut jobs.
From these totals of provincial and municipal broader public sector employment by community, I subtracted the NHS figures for employment of nurses, doctors and police officers (commissioned and non-commissioned) (From NHS tables 99-012-X2011051 and 99-012-X2011033) for each of these communities as Hudak said these jobs wouldn’t be cut. This provided net totals for the public sector workforce by community that would be affected by these cuts.
This analysis assumed then that the cuts would be made proportionate to these levels of public sector employment across the province. Hudak hasn’t provided any other details on how specifically the cuts would be implemented except to admit that they would definitely affect front-line services and mean fewer teachers.
And because the loss of these direct jobs have multiplier effects through the loss of their spending in the local community and beyond, the total impacts also include an estimate of the spin-off effects on private sector employment, using a multiplier of 0.67, as explained in my previous post.
The increase in the unemployment rates was calculated for the 15 Ontario CMAs for which Statistics Canada publishes Labour force Survey figures using the April 2014 seasonally adjusted figures from Cansim Table 282-0116.
These are of course estimates. No one knows what the impacts ultimately will be, but they are the most accurate estimates I could calculate based on the most detailed data readily available and making reasonable assumptions. Hudak has of course built his campaign around a claim that he’s going to create a million jobs through things such as corporate tax cuts, etc. The credibility of those claims will be the topic for a subsequent blog post.
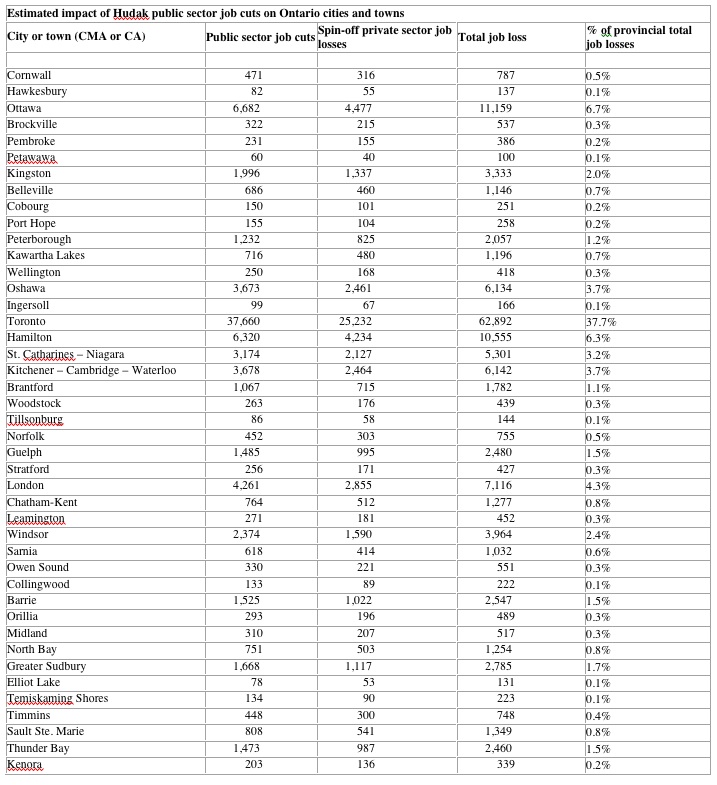
The two tables shown provide these results: the first for the 15 largest cities (Census Metropolitan Areas) for which labour force survey data are available; and the second the public and private sector job losses for all the larger cities (CMAs) as well as the smaller cities and towns (CAs).
Support rabble today!
We’re so glad you stopped by! Thanks for consuming rabble content this year.
rabble.ca is 100% reader and donor funded, so as an avid reader of our content, we hope you will consider gifting rabble with a donation during our summer fundraiser today.
Whether it be a one-time donation or a small monthly contribution, your support is critical to keep rabble writers producing the work you’ve come to rely on as a part of a healthy media diet.
Become a rabble rouser — donate to rabble.ca today.
Nick Seebruch, editor