This week, Behind the Numbers is publishing a series examining Canada’s economic recovery and scrutinizing the government’s economic message. We first looked at GDP and economic growth, then at unemployment in Canada, and yesterday we began looking at employment quality by examining underemployment. Today we continue looking at employment quality in the economy.
“We will take decisive action to ensure our economy will create good jobs and sustain a higher quality of life for our children and grandchildren.” – 2012 Budget speech
Beyond involuntary part-time employment, which we looked at yesterday, another measure of the quality of employment is the permanency of the position.
“Good jobs” are generally permanent, long-term positions; while temporary and short-term employment is generally considered to be precarious. This type of employment includes short-term contracts, ‘temp work’ and freelancing.
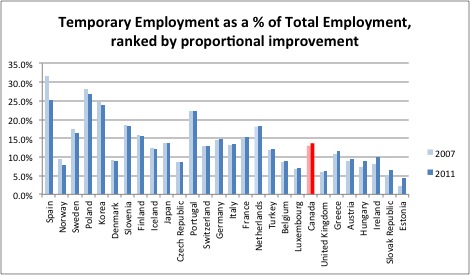
As of 2011, the most recent data available, 13.7 per cent of Canadian workers occupied positions that were not permanent. Canada ranks 17th of the OECD of 28 countries with comparable data in terms of the current proportion of the workforce that involuntarily work a part-time position.
Comparatively, Canada already had a high rate of temporary employment before the recession as can be seen in chart above. However, the rate of temporary employment has increased over the recession and recovery and it is that proportional change that this analysis is focused on.
Over the recession and recovery, 12 OECD countries reduced the proportion of workers in temporary positions. In some select cases, such as Spain, this might be linked to job losses or declining employment since the most precarious jobs are likely the first ones cut. Nevertheless, as Canada’s rate of temporary employment has increased, it suggests that Canada’s job recovery has included growth in the precariousness of employment.


In terms of proportional change in the temporary employment between 2007 and 2011, Canada is fourth out of the G-7 and 21st of the 28 OECD countries with available data. Given the grading methodology, Canada receives an F, its worst performance on any of the measures examined in this series.
To learn more about the methodology behind this blog series, click here.
Kayle Hatt is the Canadian Centre for Policy Alternatives’ 2013 Andrew Jackson Progressive Economics Intern.


